
Analyze Cloud Cost
Cloud Cost reports normalized billing data received from the provider. It answers what was observed after provider reporting delay; a Terraform estimate forecasts the cost of one proposed plan before apply.
- Typical time
- 10–25 minutes
- You need
- Cloud Cost enabled and a stored billing snapshot
- Outcome
- A period-aware cost finding with evidence and a bounded next action
Step 1: Confirm period, source, and freshness
Section titled “Step 1: Confirm period, source, and freshness”At the top of Cloud Cost, confirm the workspace, provider, account label, region, readiness state, and selected Cloud Cost billing month. The month selector loads up to 12 recent stored periods; it does not request historical data directly from the provider.
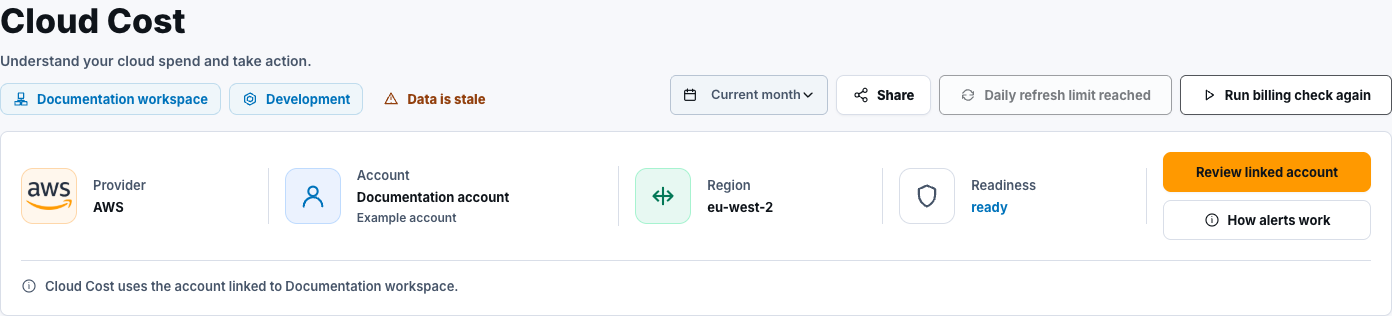
Check the latest available billing date and any stale, no-data, sync-failed, or mixed-currency notice before interpreting totals. Provider billing data can lag resource state.
Step 2: Read the Overview summary
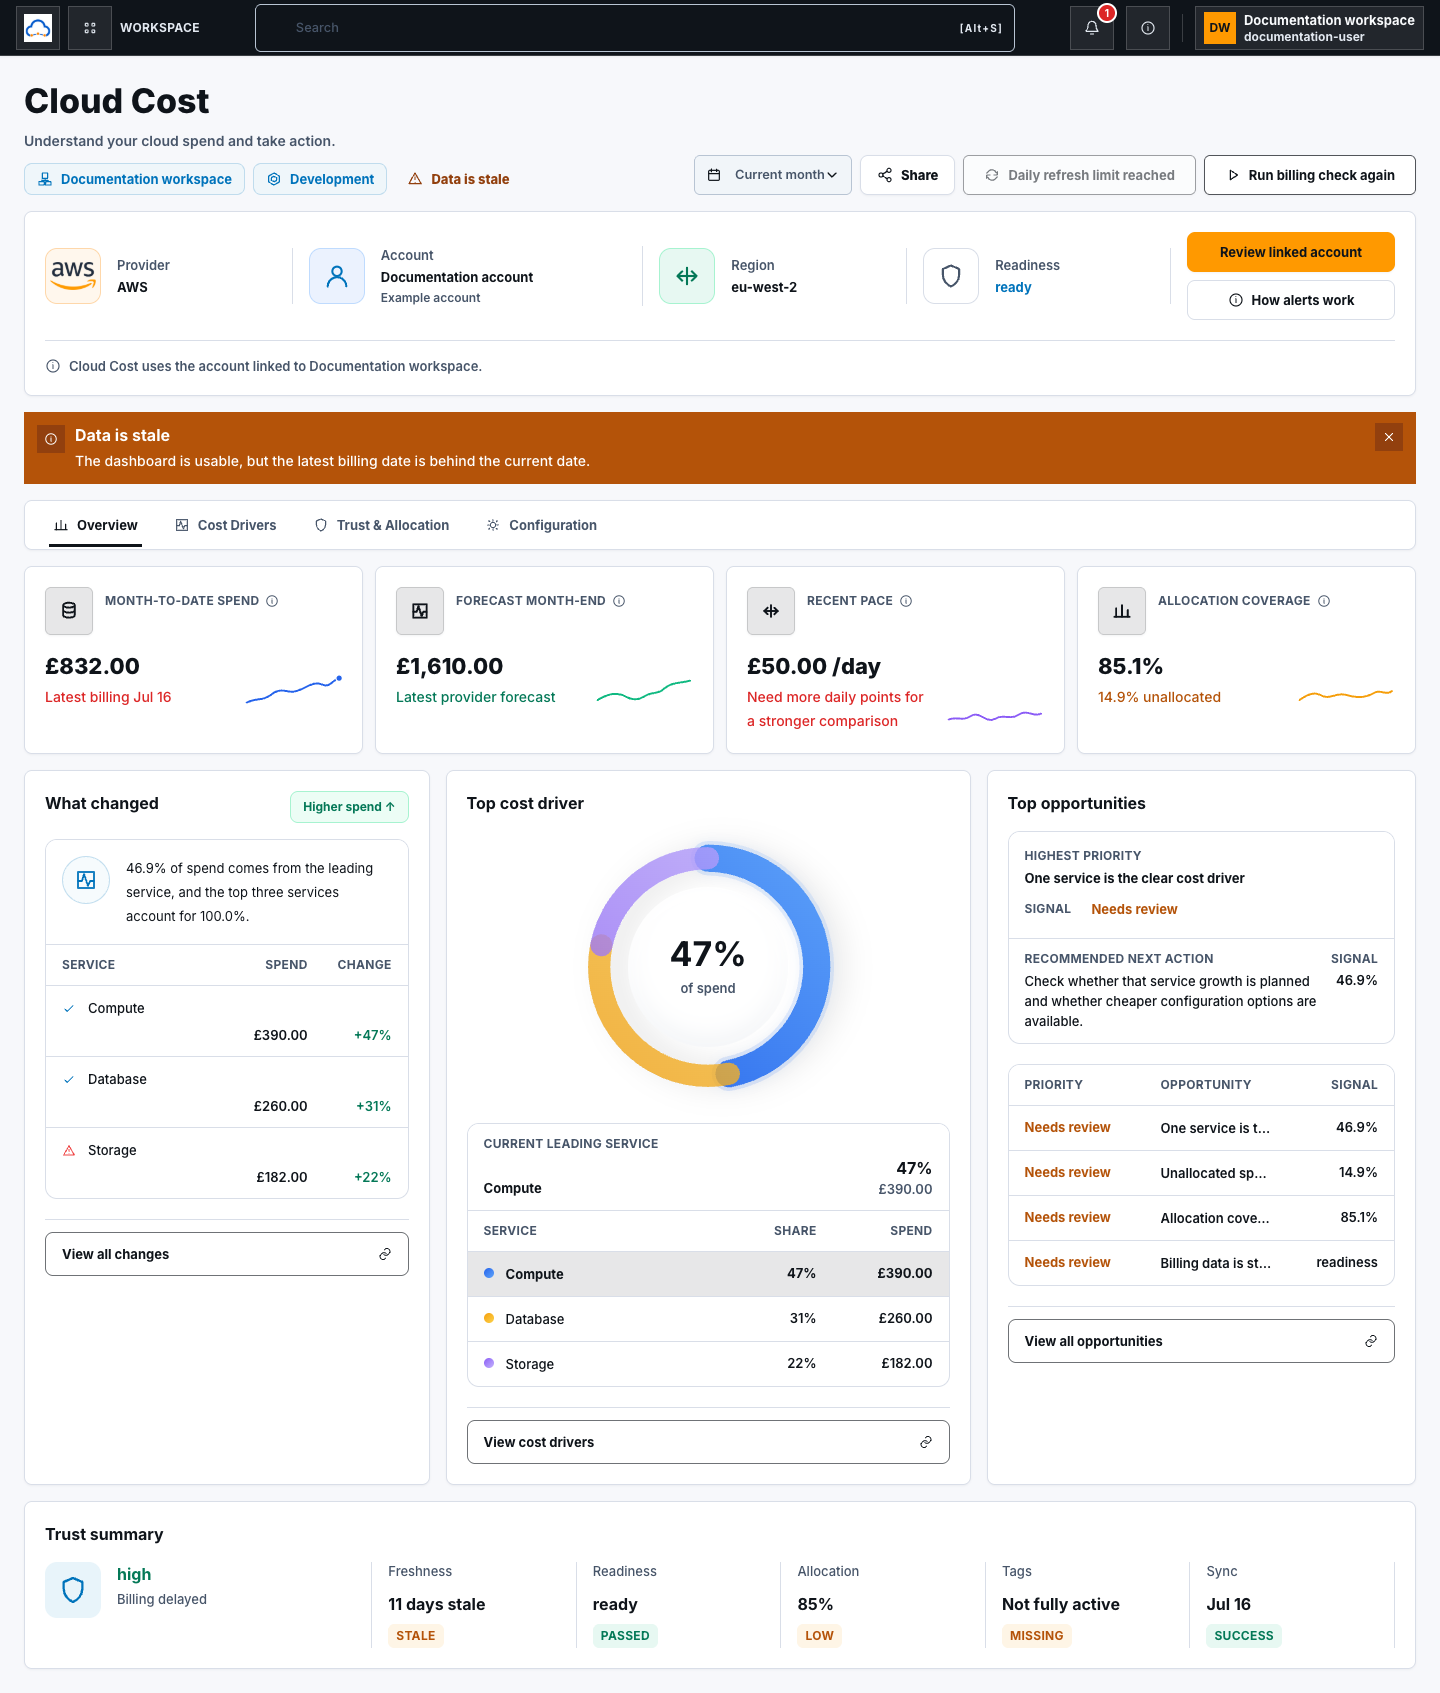
Section titled “Step 2: Read the Overview summary”On Overview, review:
- month-to-date spend and forecast month-end;
- recent pace and allocation coverage;
- What changed, Top cost driver, and Top opportunities;
- trust signals such as billing freshness, sync state, and tag coverage.
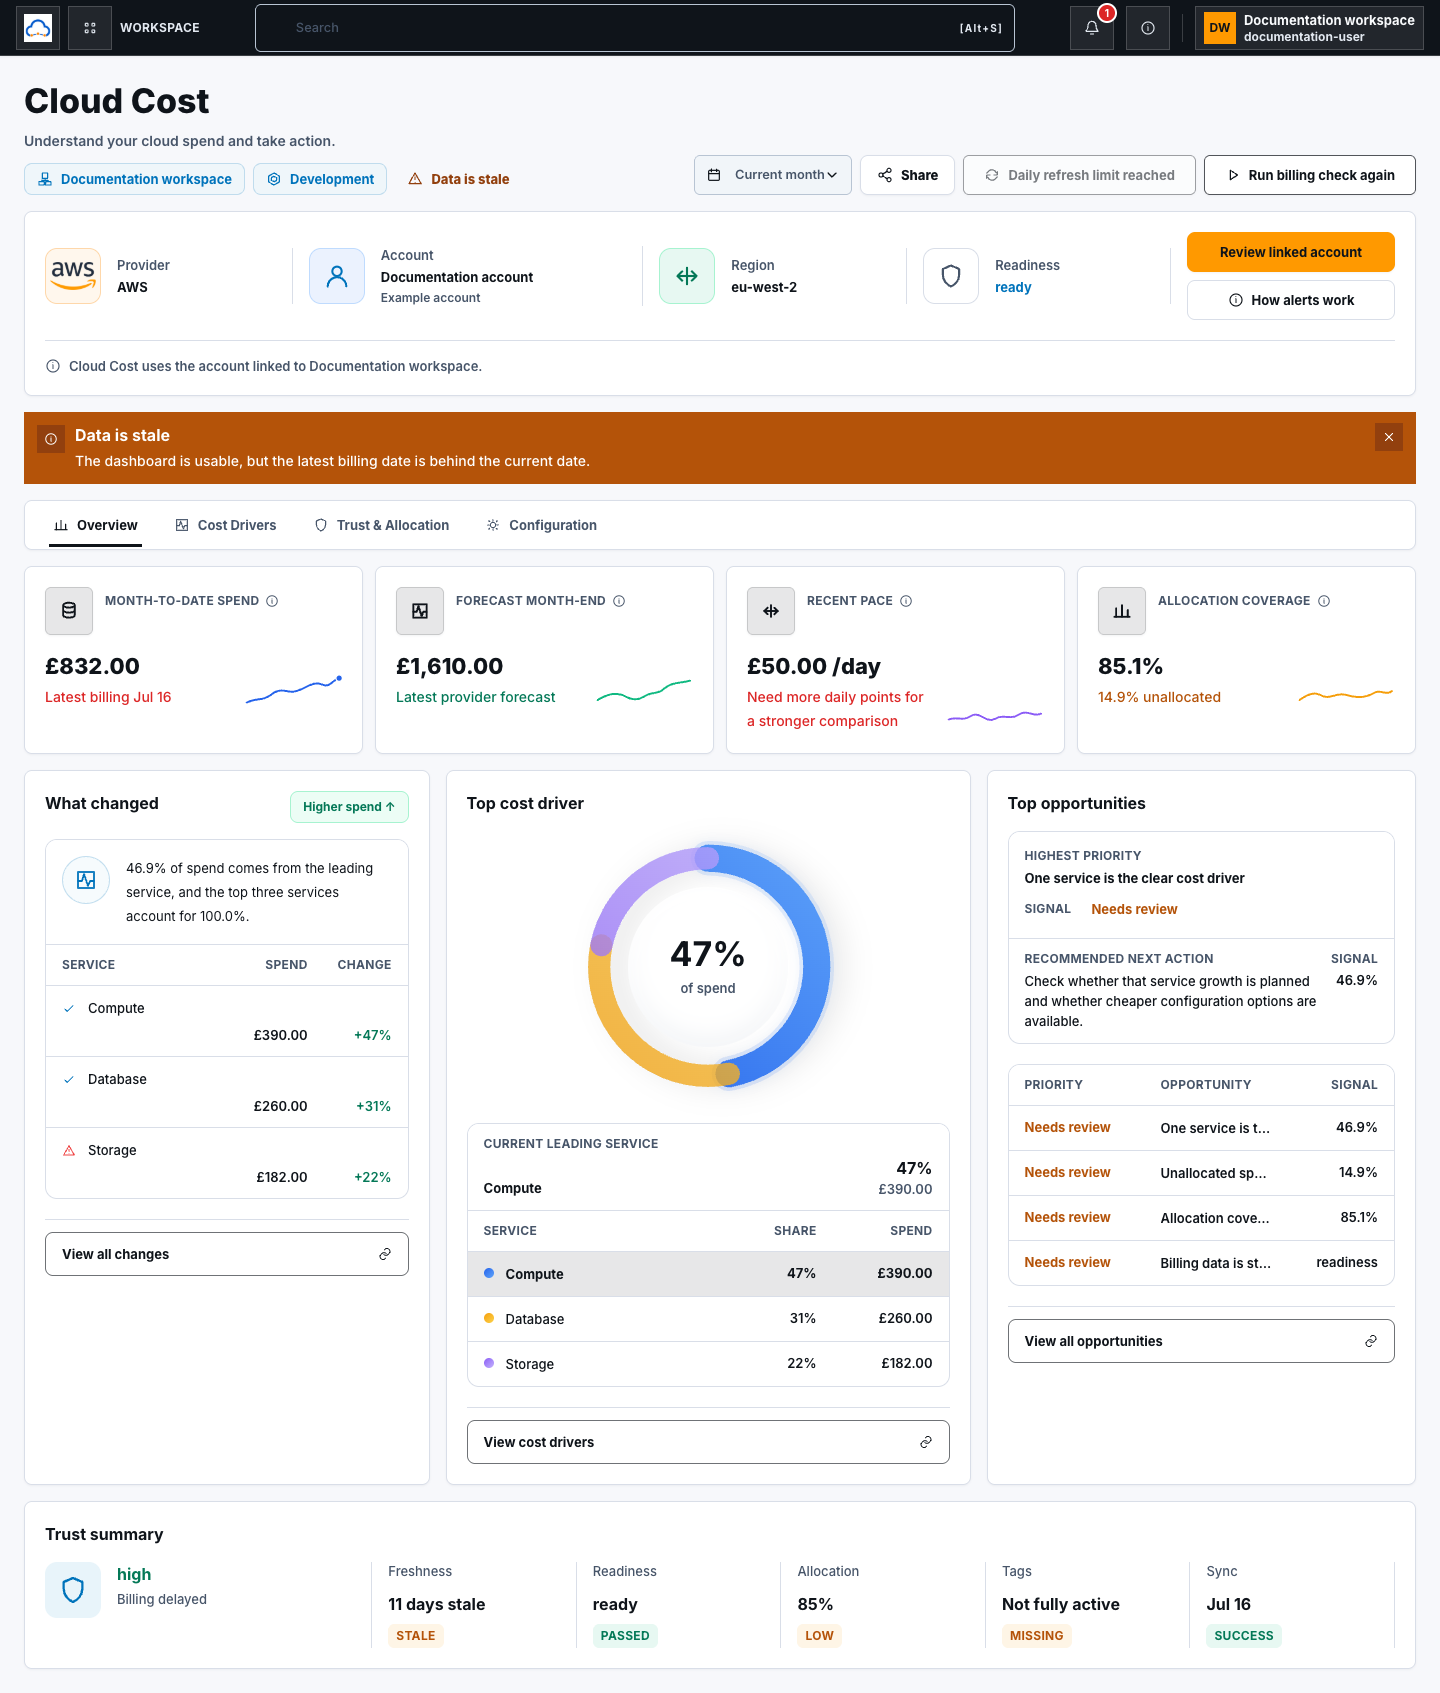
Forecast is a guide derived from observed pace, not an invoice, commitment, or replacement for a plan-linked estimate.
Step 3: Open Overview evidence drawers
Section titled “Step 3: Open Overview evidence drawers”Select View all changes, View cost drivers, or View all opportunities. The drawers provide fuller service breakdowns, evidence, source labels, and recommended next actions without changing configuration.
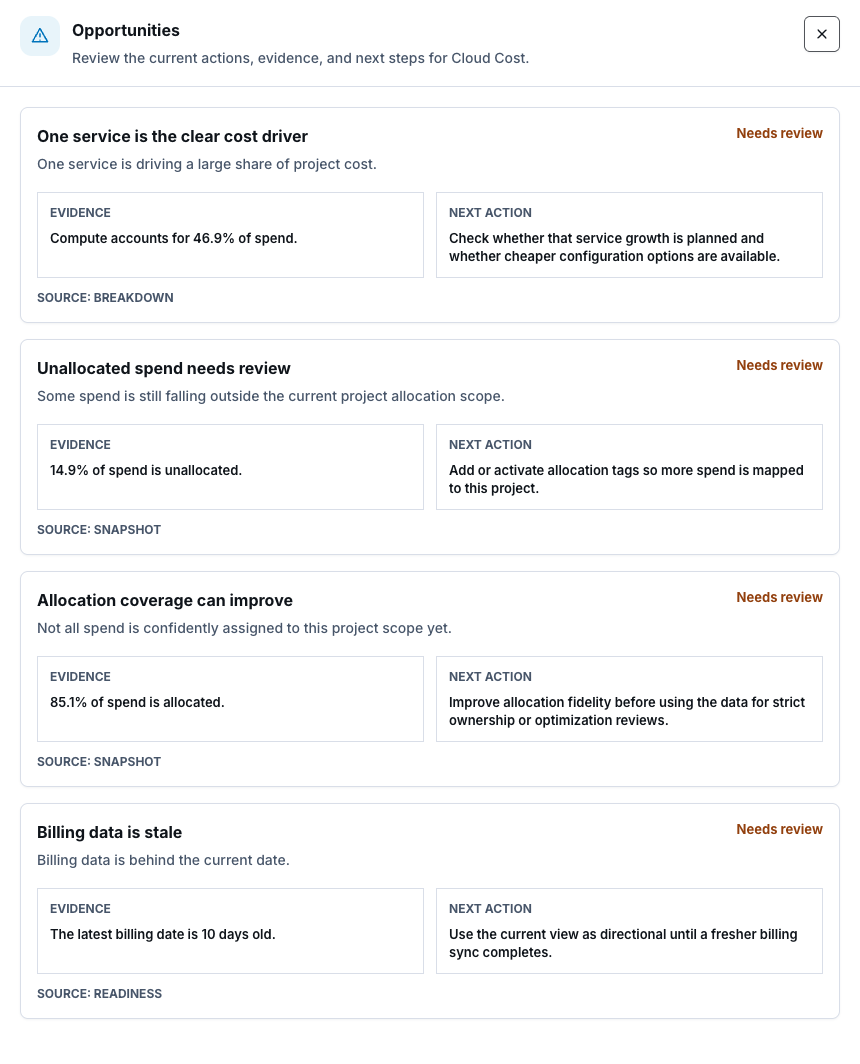
Opportunities combine deterministic billing signals and stored recommendation data when available. Treat an AI-supported suggestion as advice; verify the underlying billing evidence before changing infrastructure.
Step 4: Investigate service concentration
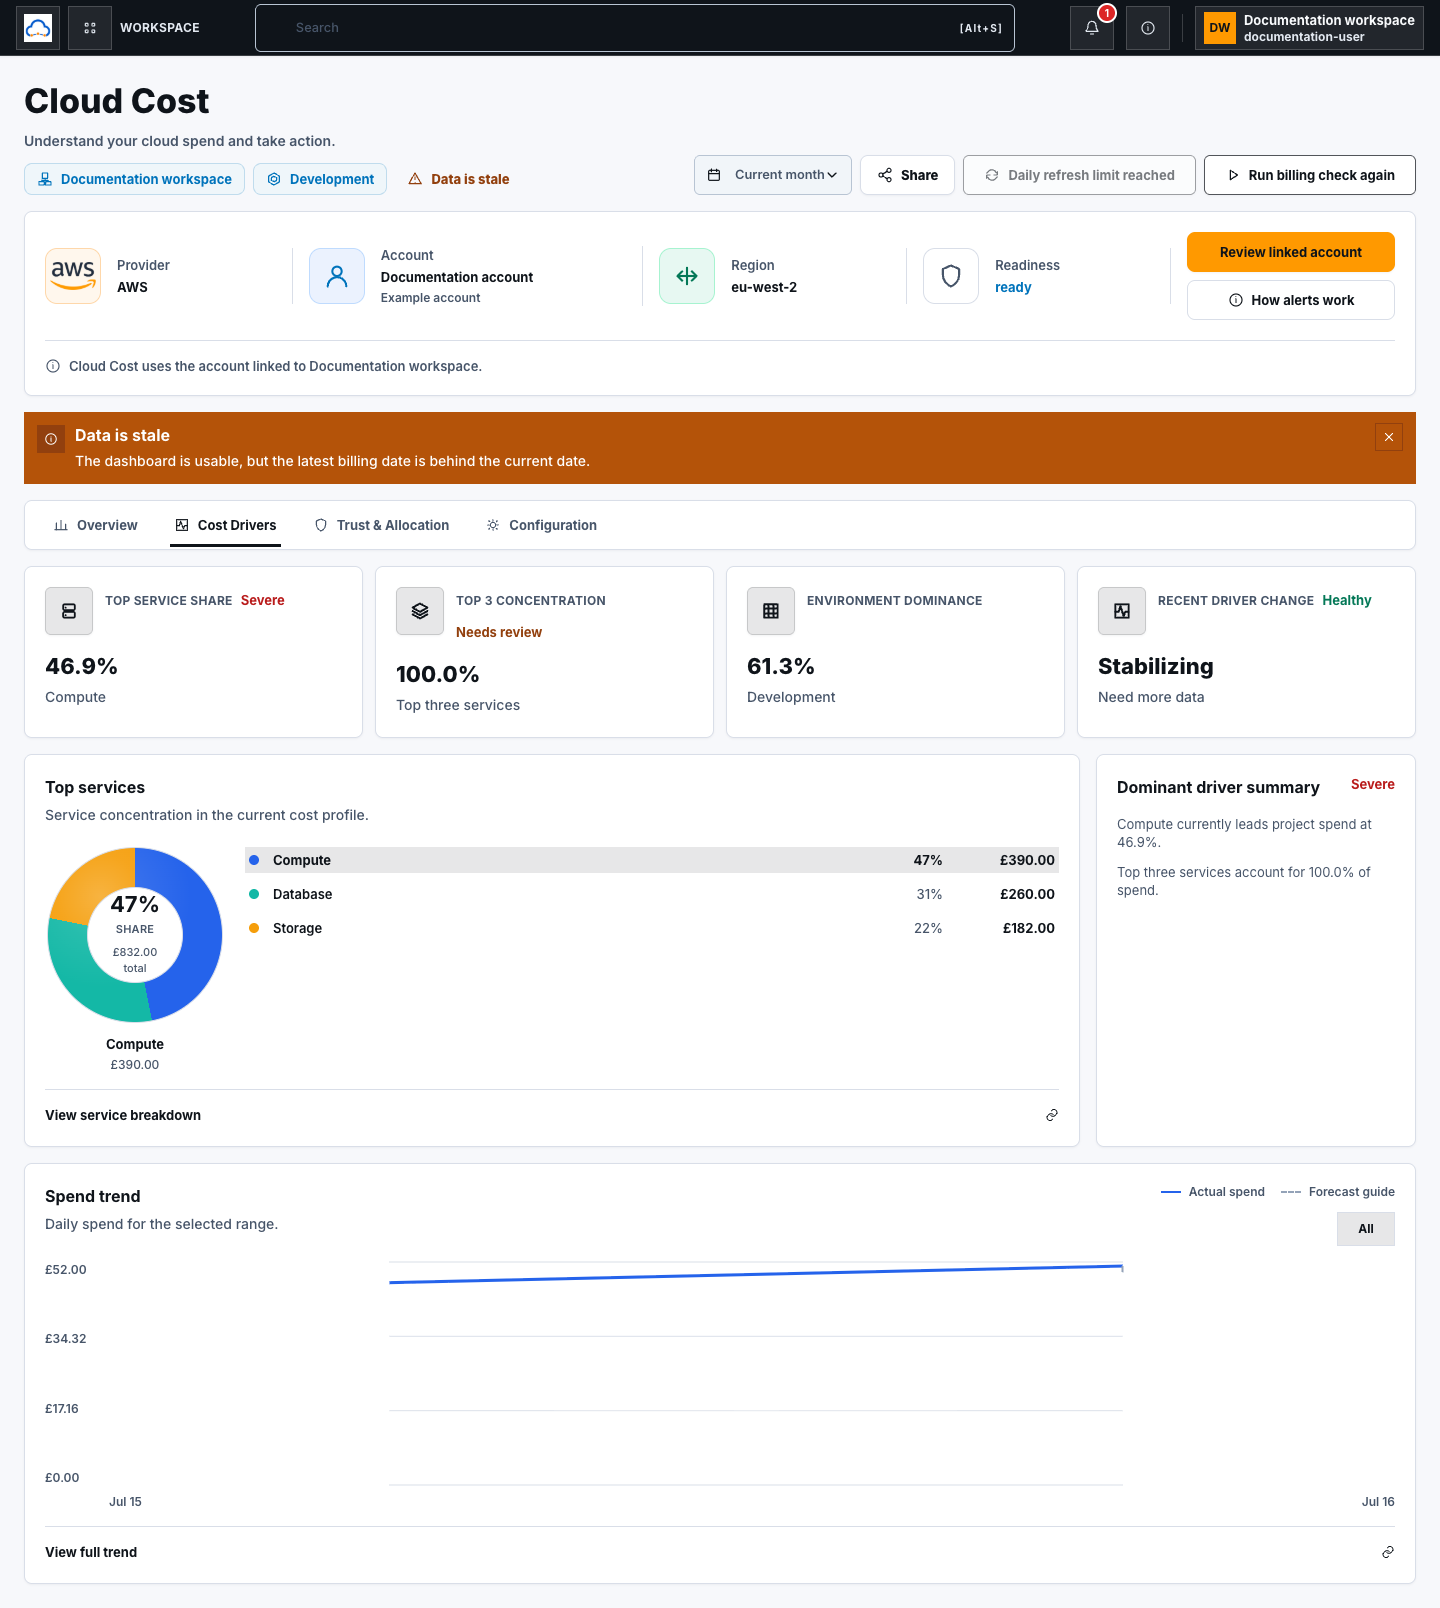
Section titled “Step 4: Investigate service concentration”Open Cost Drivers. Review Top service share, Top 3 concentration, environment dominance, and recent driver change. Select segments locally to compare visible services, then choose View service breakdown for the full drawer.
Step 5: Review the spend trend
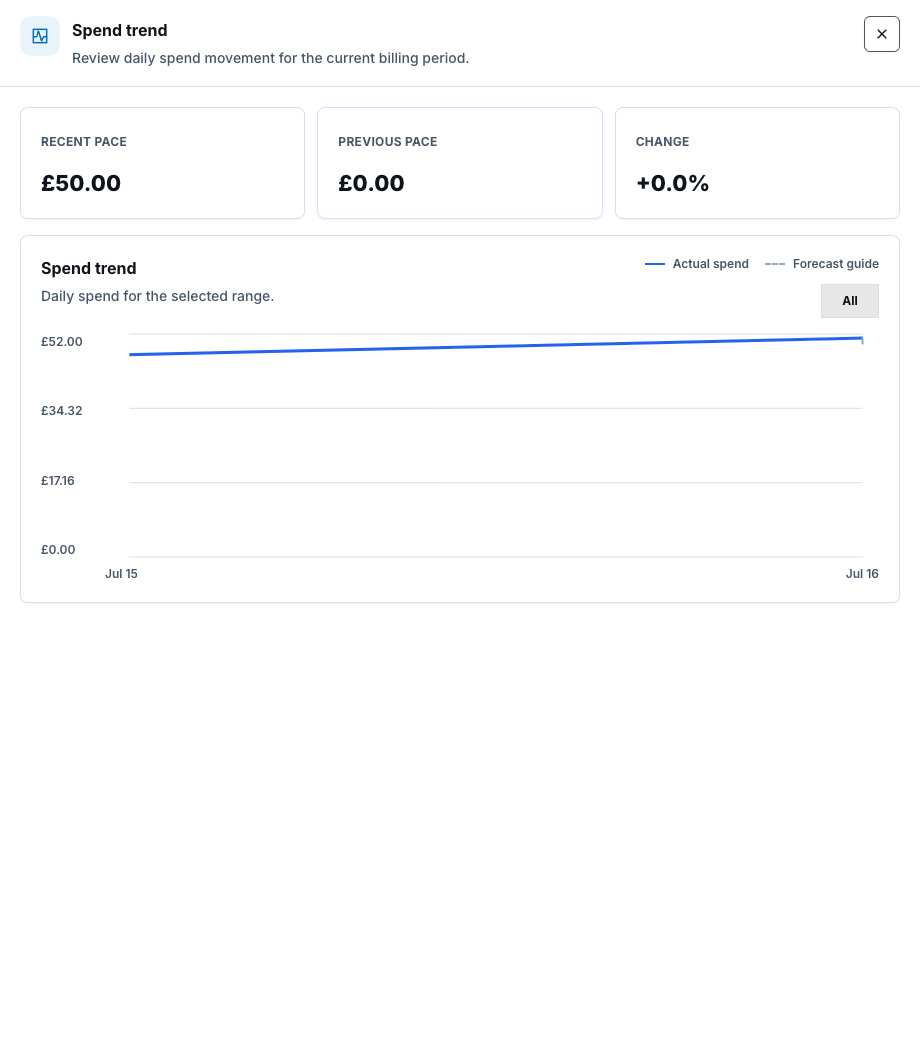
Section titled “Step 5: Review the spend trend”In Spend trend, switch among the available chart ranges. This is a local display choice within the selected billing period. Select View full trend to open the detailed drawer and compare recent pace, previous pace, and percentage change.
Step 6: Assess Trust & Allocation
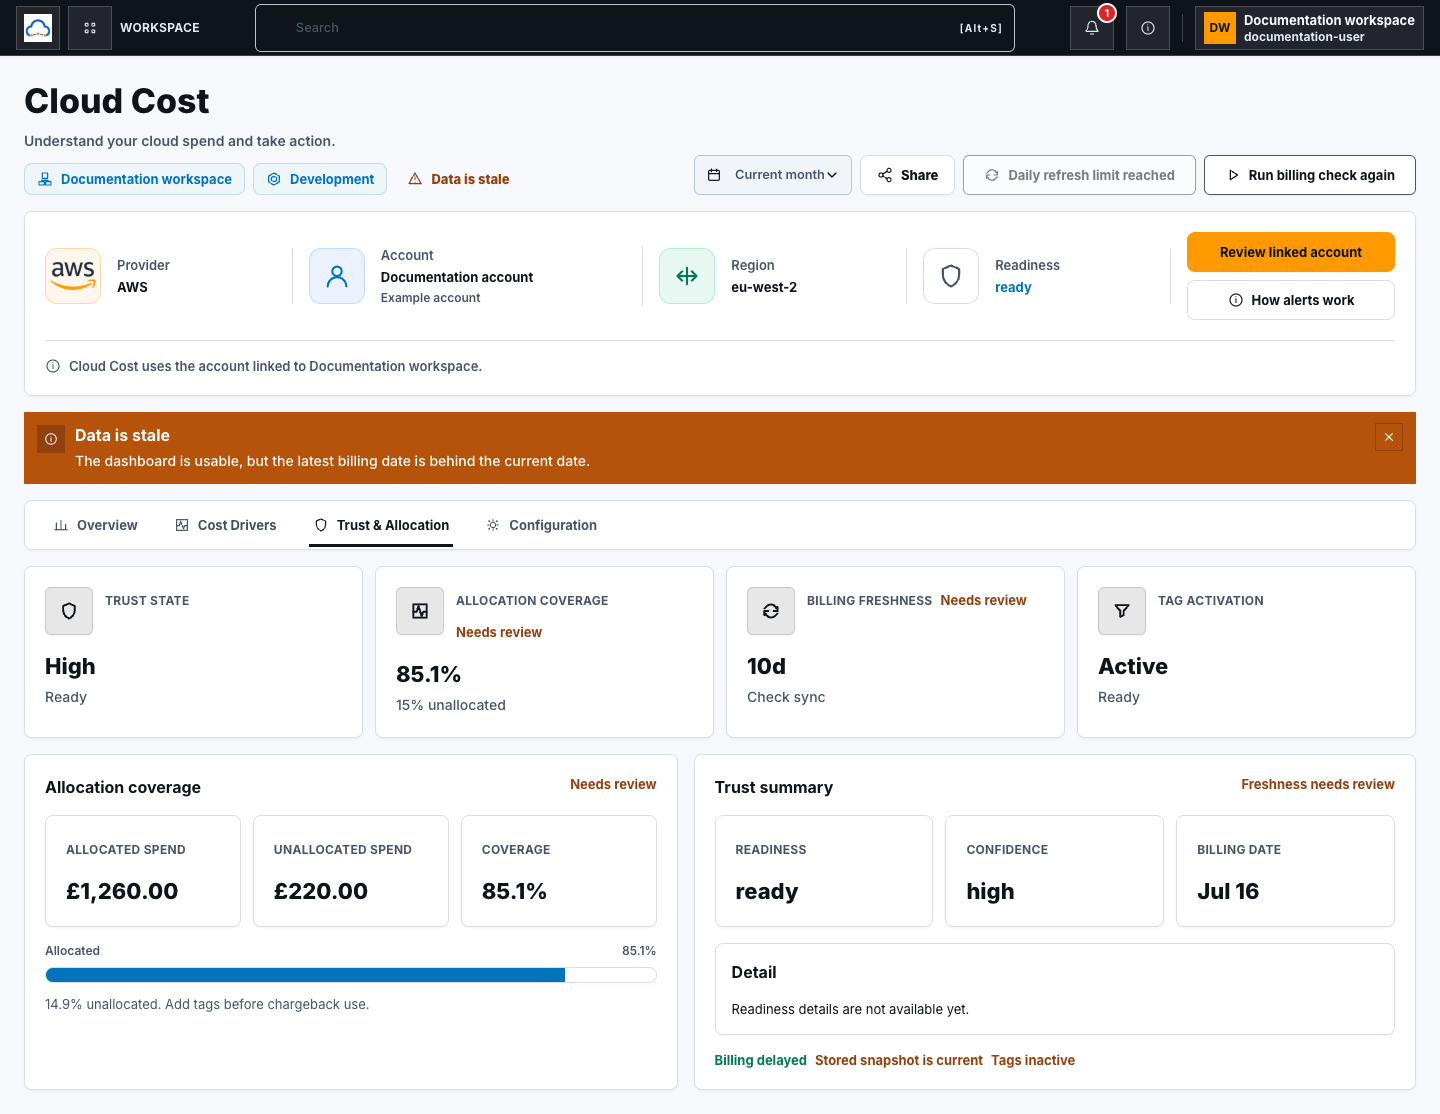
Section titled “Step 6: Assess Trust & Allocation”Open Trust & Allocation. Review Trust state, Allocation coverage, Billing freshness, and Tag activation, then read allocation and trust signals.
Low allocation coverage means provider spend cannot be reliably attributed to every project or environment. Inactive cost-allocation tags can leave the view directional even when account-level billing is available.
Step 7: Handle missing, stale, and mixed data
Section titled “Step 7: Handle missing, stale, and mixed data”Use the visible state rather than filling gaps:
- First billing snapshot pending means analysis is not ready;
- no snapshot for a historical month means no stored evidence for that period;
- stale or failed sync requires readiness and refresh review;
- Mixed billing currencies means stored amounts must be reviewed separately;
- no-data can be a valid provider response and does not equal zero future cost.
Step 8: Choose the next bounded action
Section titled “Step 8: Choose the next bounded action”Use Refresh only when the current month is active and plan capacity allows it. Repair readiness before retrying a failed sync. Improve tags for allocation gaps. Review dominant service growth before changing resources. Open Configuration only when you intend to change alerting or budget settings. Use Cloud Cost operations for Test notification and other configuration actions.
Check your result
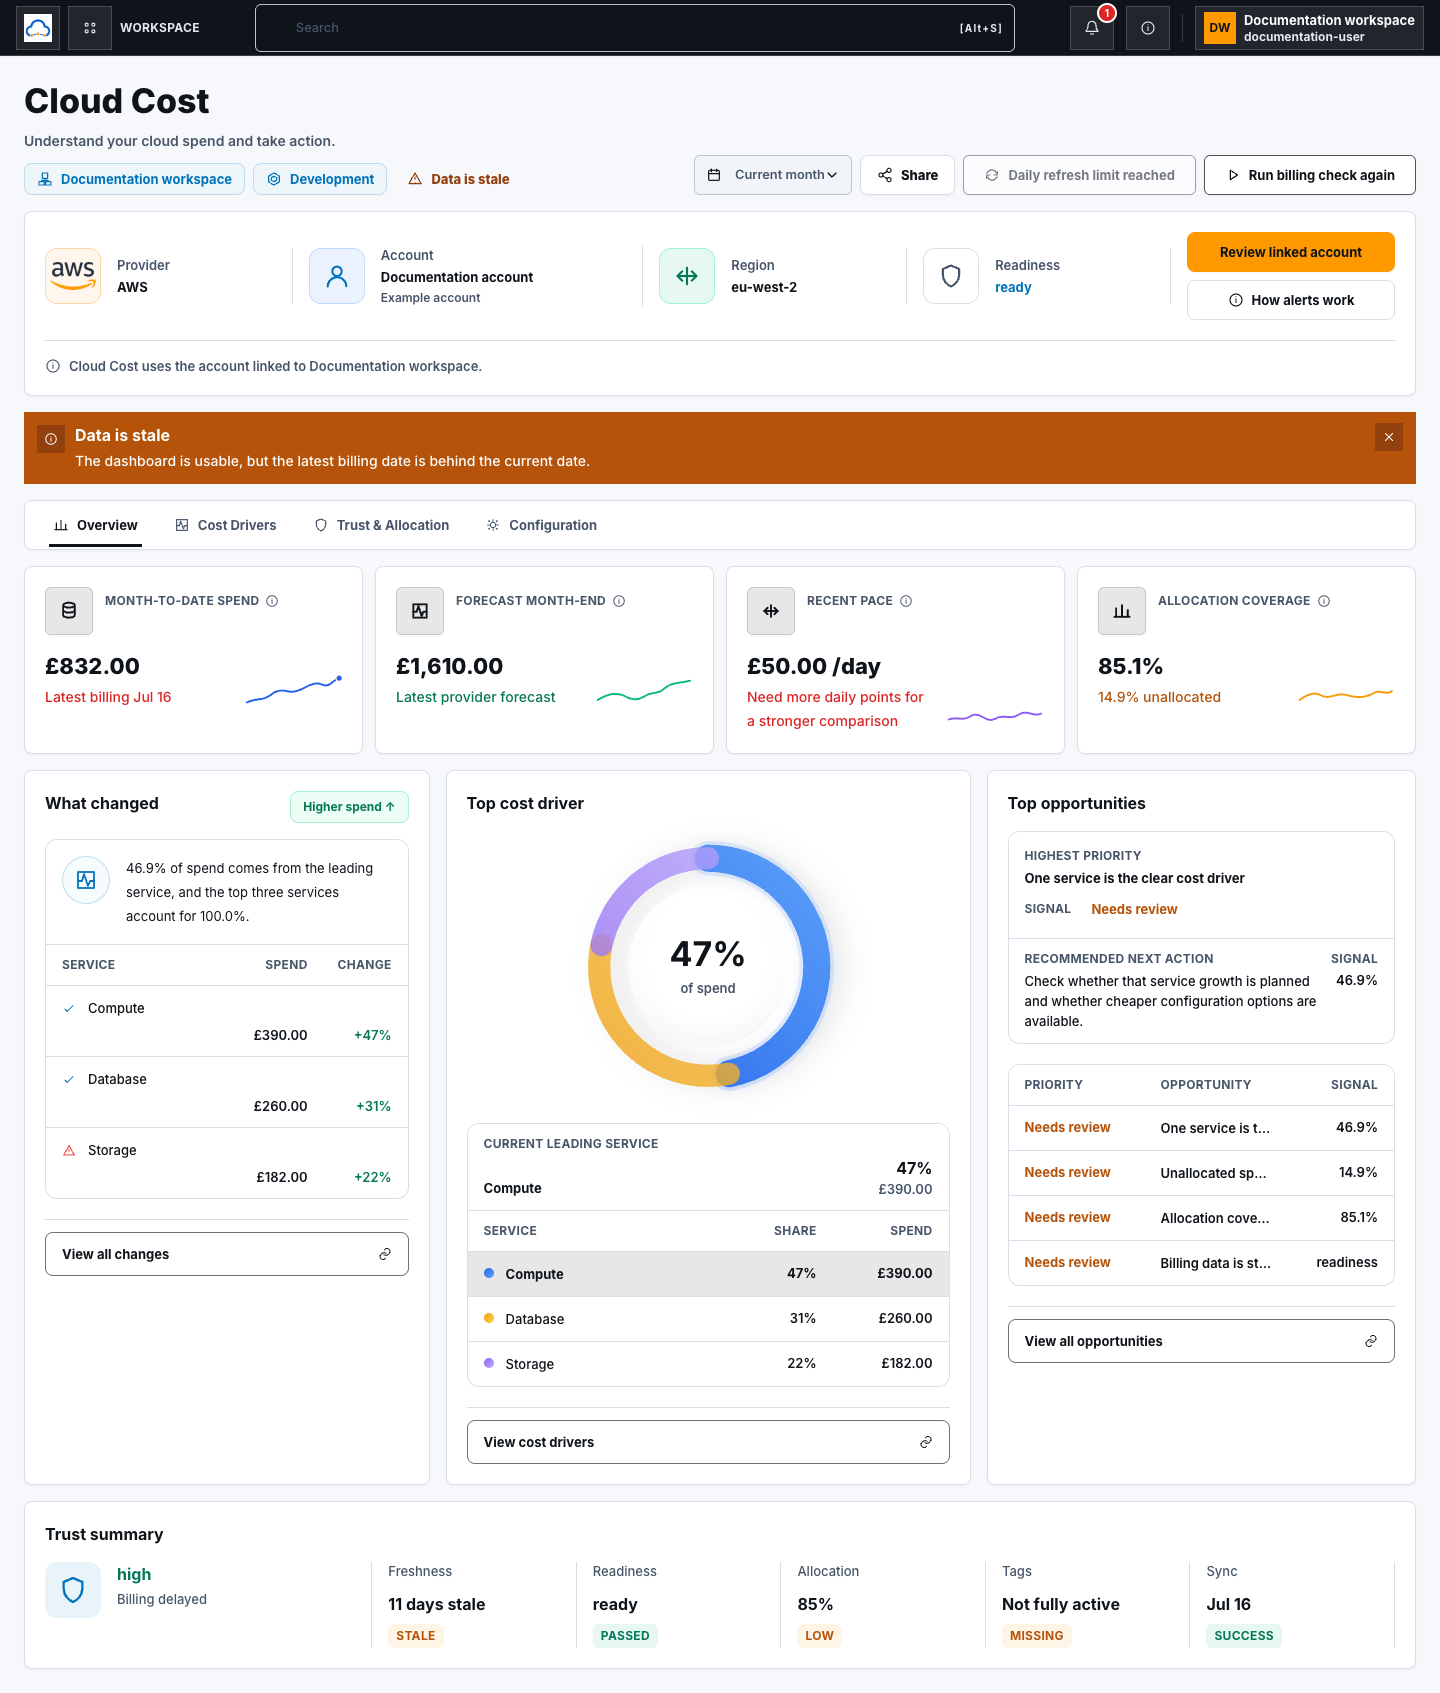
Section titled “Check your result”You can explain the workspace, period, currency, latest billing date, trust state, dominant driver, allocation gap, evidence source, and next bounded action.
Common blockers
Section titled “Common blockers”- No stored snapshot: wait for or retry the first sync; absence is not zero.
- Historical month unavailable: choose a month with a stored snapshot.
- Stale data: inspect readiness, scheduled-sync status, and refresh capacity.
- Mixed currencies: do not combine unlike provider amounts.
- Opportunity uncertain: verify its evidence and source before acting.
The dashboard uses normalized snapshots, not raw billing exports. Do not claim fresh provider data or recommendation effectiveness without live runtime evidence.